
Manual vs Automatic Overfeed Control
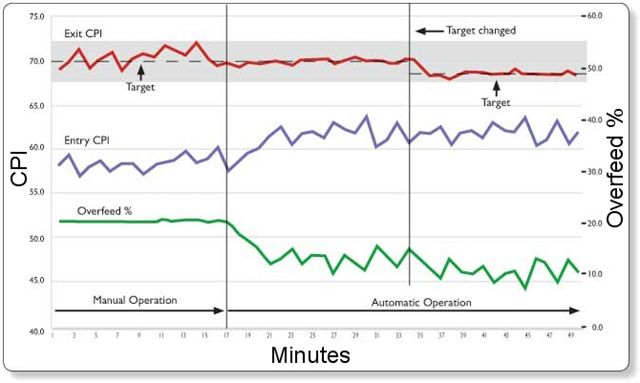
The graph at left shows the density results of a lot of fabric, finished first with a constant overfeed, then with automatic overfeed control in response to density changes at the entry. In addition, the graph demonstrates the extra earning potential once effective control is achieved:
- If you lower the inital setpoint of 70.0 CPI to 68.5 CPI you will obtain a 2.1% increase in the length of fabric produced.